
Data feed [not currently reporting]: https://io.adafruit.com/brenchies/dashboards/wateruba-1
In our first citizen science program in 2019, we set up a pilot ocean acidification monitoring station, monitoring pH, D.O. and temperature. In 2021, we will collaboratively build and install additional sensor stations aiming to explore readings on both sides of the island, and different depths of the ocean, with a focus on coral reef areas. Monitoring buoys will have autonomous power supply and communication using solar panels and GSM connections. Open workshops to build the stations will be held at Brenchie’s Lab on Wednesday evenings beginning November 24th. Once they’re built, we’ll organize weekend field sessions to test them in the ocean in various locations. In the end we’ll share our code, designs for building, programming, and deciding where to install the sensor stations online so others can learn from our experiences.
Code: Github repository
Lab sessions: Nov 24, Dec 1
6-8pm at Brenchie’s Lab, Caya Betico Croes 59
Field sessions: Dec 16, Dec 17
10am-1pm at Waf’i Rancho
SESSION 1 RECAP
November 24, 2021
ADAFRUIT IO
Using the code we wrote in 2019, and with the progress made by our awesome interns Diquan and Felix over the past couple of weeks, we were able to get our existing sensor station uploading data to an Adafruit IO dashboard. That means you can see the data from the sensors live right now if you click on this link:
https://io.adafruit.com/brenchies/dashboards/wateruba-1
We also explored a few other interesting tools that might help us improve on the design for the other stations we’re planning to build. Using the Adafruit IO Arduino library and example sketches, we were able to use an Arduino to grab data from the feed of another sensor station and repost it. This is useful because it lets you collect feeds from wherever and centralize them to one account, so you could set up a single dashboard with data from multiple other accounts.
Another tool we tested out was an Arduino MKR GSM 1400 board we have. It’s quite a bit different from most basic Arduinos, and has a slot for a SIM card so that it can connect to the internet through cell towers, rather than wifi. This is handy so that we could use it to build a sensor station that can upload data without being next to a wifi network, which could work anywhere that has cell service. We tried to get it running a basic code, but Arduino gave us an error so we’ll need to keep trying with it.
The last thing we tested was an SD card breakout board, which can be connected to an Arduino for offline data recording. This isn’t quite as useful for data sharing, but it can be a lot simpler to set up. One great application we’re thinking of for this is our mobile monitor, so we would strap it to a kayak for example, turn it on, go paddling, and it would measure and record data. Afterwards we take out the SD card and upload / analyze the data we collected. It’s also useful in locations with neither wifi nor cell service. We didn’t quite get it going but we wired it up and installed the libraries and programmed a simple script. It didn’t end up saving anything so there’s something wrong somewhere, we just need to troubleshoot.
SESSION 2 RECAP
December 1, 2021
COLLABORATION
To get our working sensors into the wild, we still have to figure out how we’re going to install it and where. And arrange for it to have power and wifi connections.
Since we’re located in Oranjestad, we wanted to put the station somewhere nearby. With support from our friends at Stichting Rancho, we were given permission to install it at Waf’i Rancho in Oranjestad Harbour. They asked that we speak with the local fisherman about the project and that we install a sign with the station that explains what it does.
We scoped out the area with a wifi scanning app (Wigle Wifi) and saw that there was a good signal from the nearby Harbour House condominiums. When we approached them they agreed to give us the info we needed to connect our sensor station. They also asked us about the purpose of the project, and were happy to support our citizen science efforts!
So we reprogrammed the board to upload to the brenchies Adafruit IO account, added in the wifi credentials for the harbour, and set up a dashboard for the data. All that’s left for this one now is to install it.
Our intern, Jeandrick, also explored some options for future monitoring stations. Following up on our last session, he was able to get an SD recording data on Arduino from a DHT11 temperature and humidity sensor. He also was able to program the MKR GSM 1400 board with the blink example, and it worked. Great stuff!
MKR GSM 1400
To release us from the limits of wifi, we’re trying to get the MKR GSM 1400 board reading sensor data and sending it to the cloud. Because ThinkSpeak has a library that works with it, and because Atlas Scientific uses it, we’re going to try that platform first.
Ideally, our code mashing formula will work as follows:
Thingspeak MKRGSM1400 example + Atlas Scientific IoT Hydroponics with DO example + Wateruba v5 = GSM IoT Monitoring Station!
HYDROPONICS KIT
We’re testing out another version of the station, designed by Atlas Scientific for monitoring hydroponics systems. We customized the components a bit, the link to the main kit is here:
https://atlas-scientific.com/kits/wi-fi-hydroponics-kit/
Here is the simplified process for setting it up.
All of these steps and detailed explanations are in the Atlas Scientific setup guide here: https://files.atlas-scientific.com/Wi-Fi-Hydroponics-kit-setup-guide.pdf
Below are the key steps we’re noting here as we do them:
- Switch all of the EZO sensor circuits to i2c mode using Step 2 of these instructions: https://www.instructables.com/UART-AND-I2C-MODE-SWITCHING-FOR-ATLAS-SCIENTIFIC-E/
- Set up your ThingSpeak account, you’ll need to register a MathWorks account, then log in to the ThingSpeak website, and create a channel with one field for each sensor, ours were pH, EC (μS/cm), Temp (°C), and DO (mg/L)
- Download and install the Arduino IDE (https://www.arduino.cc/en/software)
- Install the ESP32 boards in Arduino (https://docs.espressif.com/projects/arduino-esp32/en/latest/installing.html)
- Download and install Arduino Libraries for ThingSpeak (https://www.arduinolibraries.info/libraries/thing-speak) and Ezo_I2c (https://github.com/Atlas-Scientific/Ezo_I2c_lib)
- Open the example code from Atlas, for ours this was under File>Examples>Ezo_I2c_lib-master>Examples>IOT_kits>hydroponics_kit_with_DO (which is also on their github page here: https://github.com/Atlas-Scientific/Ezo_I2c_lib/blob/master/Examples/IOT_kits/hydroponics_kit_with_DO/hydroponics_kit_with_DO.ino)
- Edit the code, adding your WiFi and ThingSpeak credentials on lines 15-18, and uncommenting the correct group of enable pins for your board version on lines 40-52. Ours is version 1.4 so we uncommented lines 41-44 and commented out lines 48-51
- Plug in and program your board, making sure you set the board to Adafruit ESP32 Feather and check that the correct COM port is working and selected
- Check the serial monitor to make sure it’s working. If you haven’t plugged anything in yet it should be reading No Data.
- Unplug the board, and install the EZO circuits and sensors
- Plug it back in and read the data, which should also be uploading to ThingSpeak
- Calibrate your sensors using the guide from Atlas
2019
Our first version of this water quality sensor was put together using sensors from Atlas Scientific, including their pH probe, temperature probe, and dissolved oxygen probe. Atlas has links on each of the probe pages about how to read the sensors using an Arduino, so we combined those into one program and added some code to send the information out online by using an ESP8266 based Arduino compatible chip with wifi. The monitoring station isn’t currently plugged in, but you can see what the output looked like here. This pool kit they sell gives you an idea of what the circuit looks like, with slightly different sensors.
The original code is on Github here: https://github.com/brenchies/water-quality/blob/main/wateruba_v1.ino
We built the system, tested it, and were on the verge of installing it in the ocean when the pandemic hit last year, so we’re working out a new place to put it. We’ve also found a better option for sharing the data online, through the Adafruit IO platform. It let’s you put together a dashboard with live data and chart displays (here’s one of our air quality sensor dashboards) and saves your data for the last 30 days, so you can download it and put it into a spreadsheet or database. You have have 10 sensors and 30 days of data for free, or unlimited sensors and more data storage for a small monthly fee.
2021
With the second round of development, we’re going to start by updating the previous version to connect to Adafruit IO, and verify that it works and is water tight for installation outdoors. Then we’ll arrange a spot where we can install it that has wifi and a power outlet, ideally somewhere we can check on it easily.
For additional monitoring options, we’ll try out stations installed on existing buoys or moorings, and also put one together that can be taken on short excursions. Differences between the three options are below.
Variations
Pier – Stationary, connected to a fixed structure with wifi and power plugged in. Starting with pH, T, and DO.
->This one is now installed in Oranjestad harbour, programmed with this code: https://github.com/brenchies/water-quality/blob/main/waterubaV5.ino
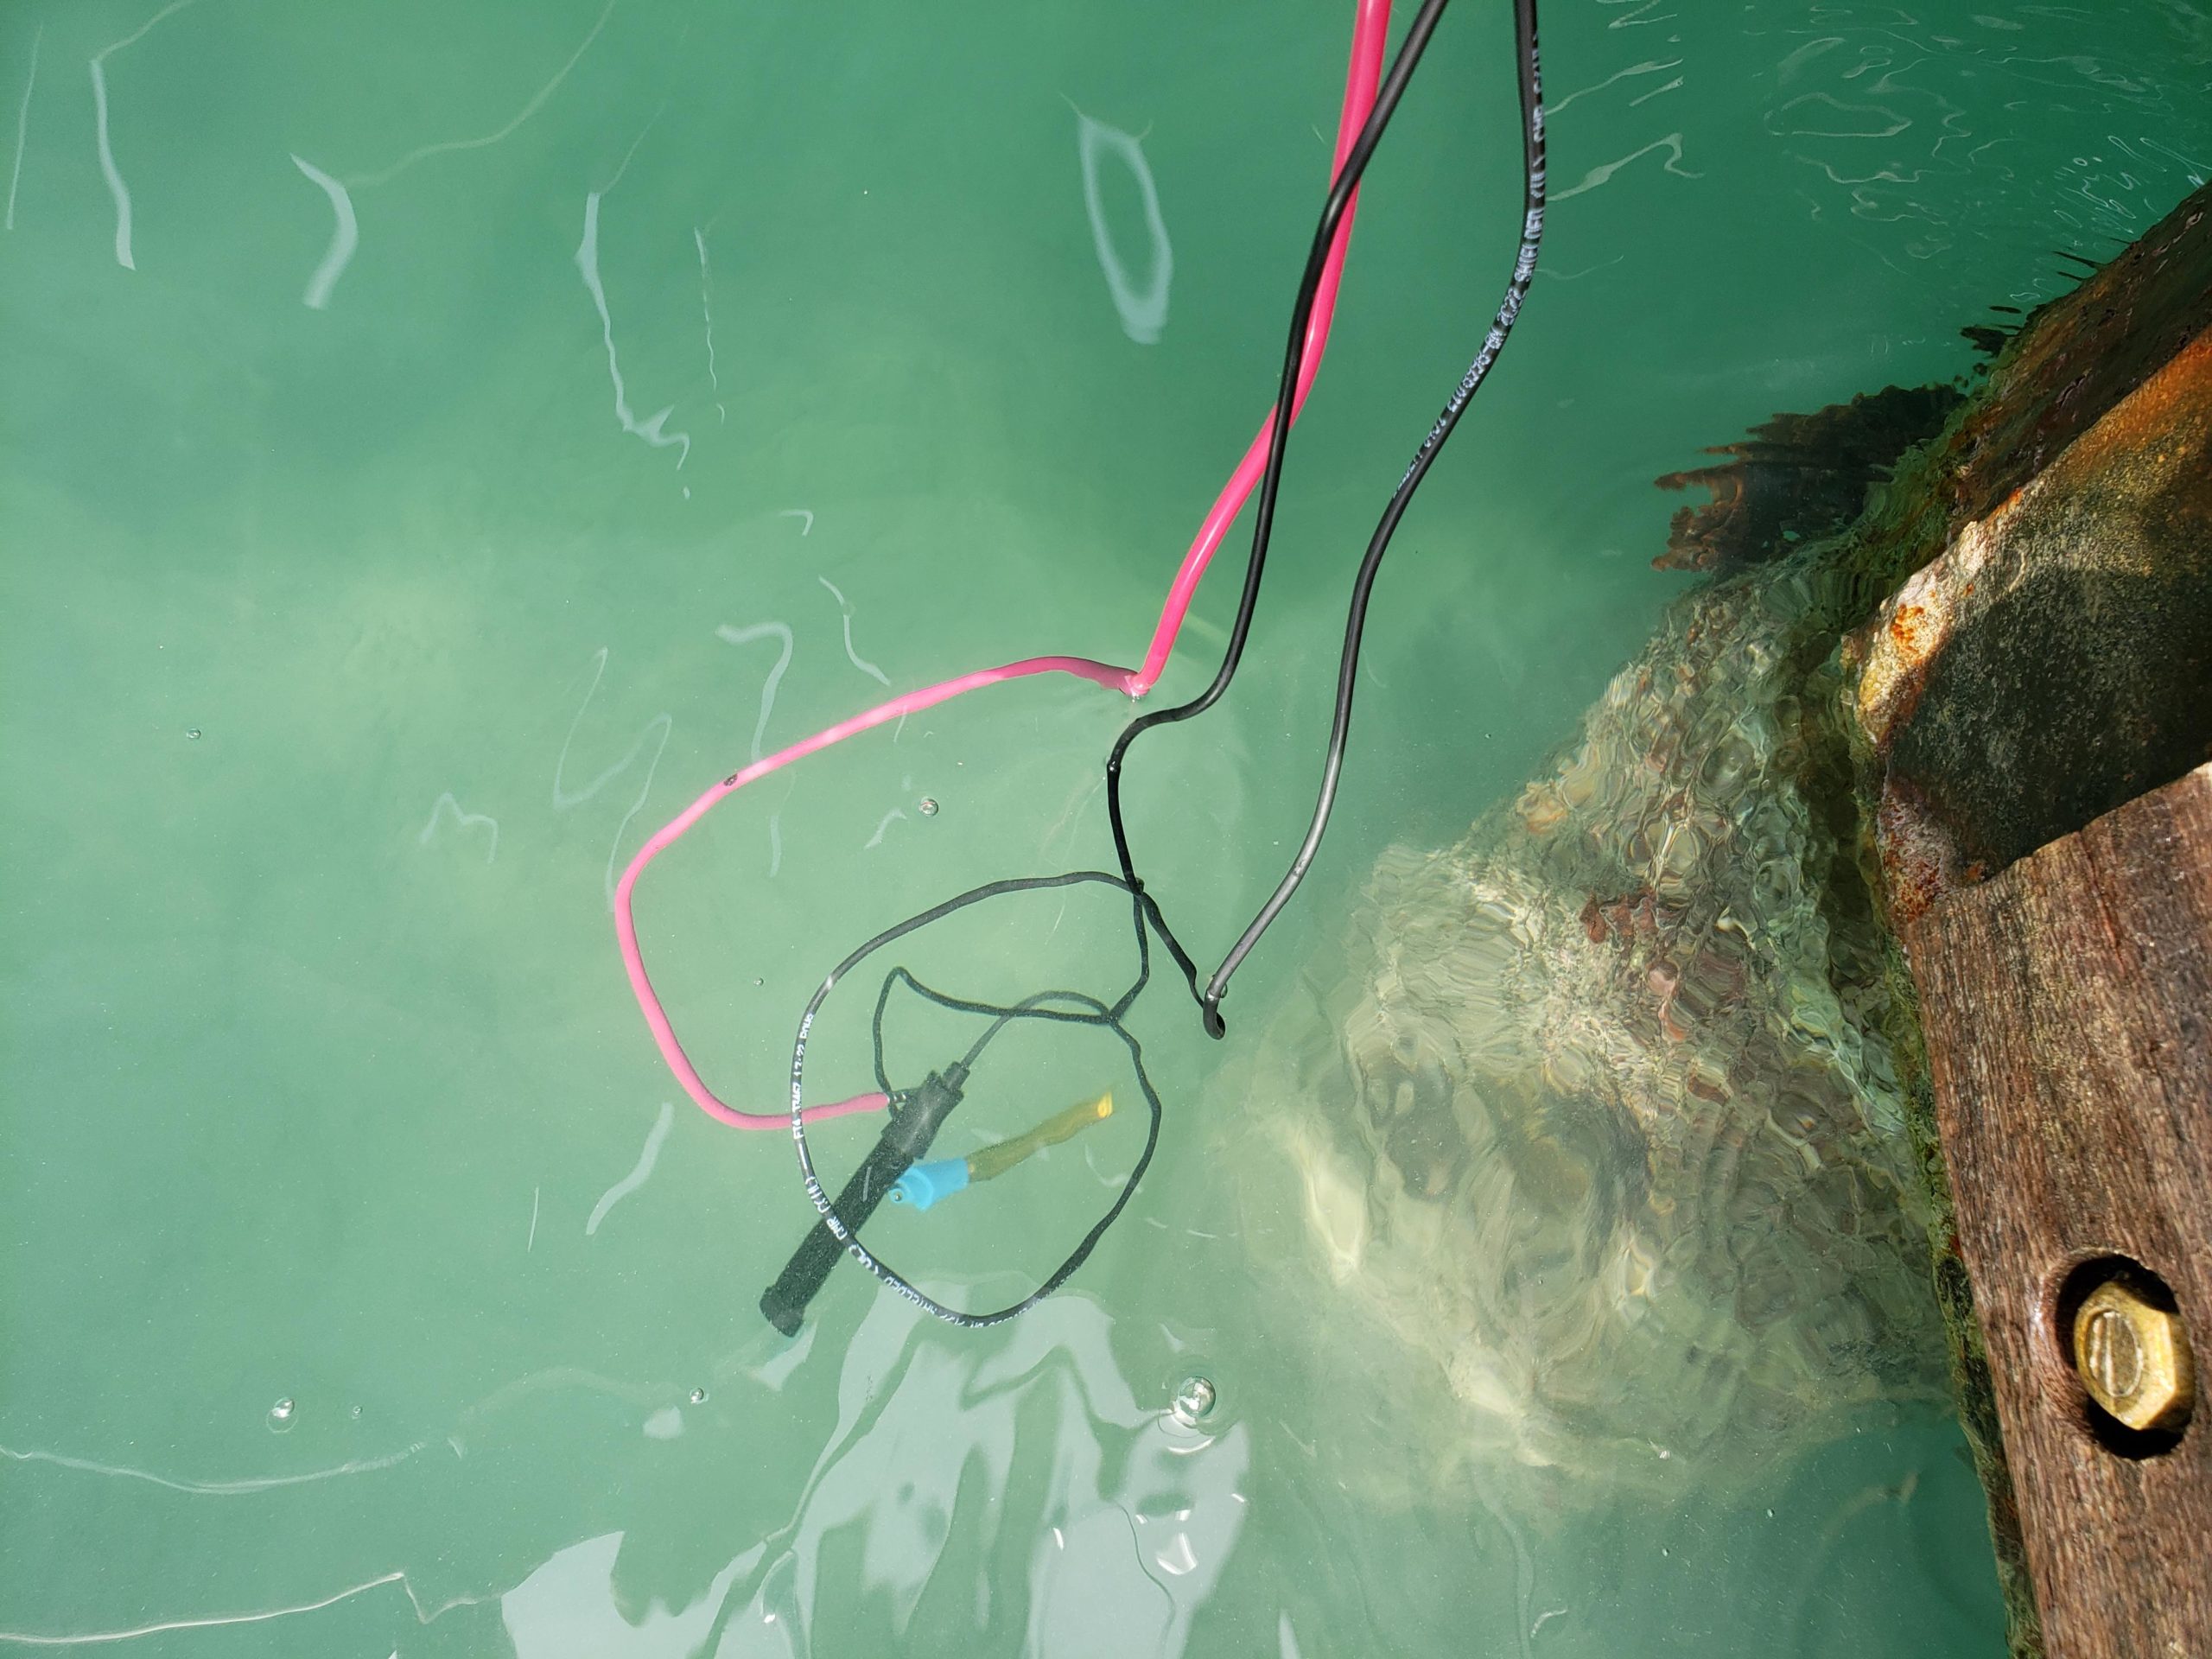
UPDATE: this sensor station accumulated a lot of algae, and one of the probes wire broke and it fell off, so it’s currently being repaired. Luckily one of the local fisherman noticed and retrieved the sensor for us from the sea floor. Thanks man!
Buoy – Floating but anchored, requires better power control and battery with solar charger, and GSM communication. Ideally also measuring conductivity/salinity, but maybe not ORP for now.
Kayak – Straps onto a kayak to monitor the ocean while you paddle, needs a battery and GPS to track location, and onboard data storage. Would like to measure as many parameters as possible. Could be coupled with seafloor mapping with a GoPro or other camera in the future, as well as bathymetry measurements of water depth. We have a foldable Kayak on the way so it can be fit into a car and taken to different sites around the island.
Relevant links
Public Labs water quality measurement (mostly freshwater focused) – https://publiclab.org/notes/anngneal/12-08-2017/7-ways-to-measure-monitor-and-evaluate-water-quality
Atlas Scientific adding DO to hydroponics kit – https://www.hackster.io/atlasscientific/add-dissolved-oxygen-to-the-wifi-hydroponics-kit-386601
Smart Buoy – https://www.instructables.com/Smart-Buoy/