Note: This post was written a few years ago, and a newer version of this research will be published soon. The results of the research below include a preliminary image classification model, a prototype drone and mapping dashboard, and related methodological insights into low-tech seafloor mapping processes. Links are here:
- Image classification model: https://github.com/brenchies/reef-mapping-image-recognition
- Prototype drone mapping: https://jeremygranadillo.com/
- Methods for seafloor mapping: https://medium.com/@tony_87301/how-citizen-science-can-help-sids-reach-sdgs-8ef2920b7e00 (see end of Results section)
21 October, 2019
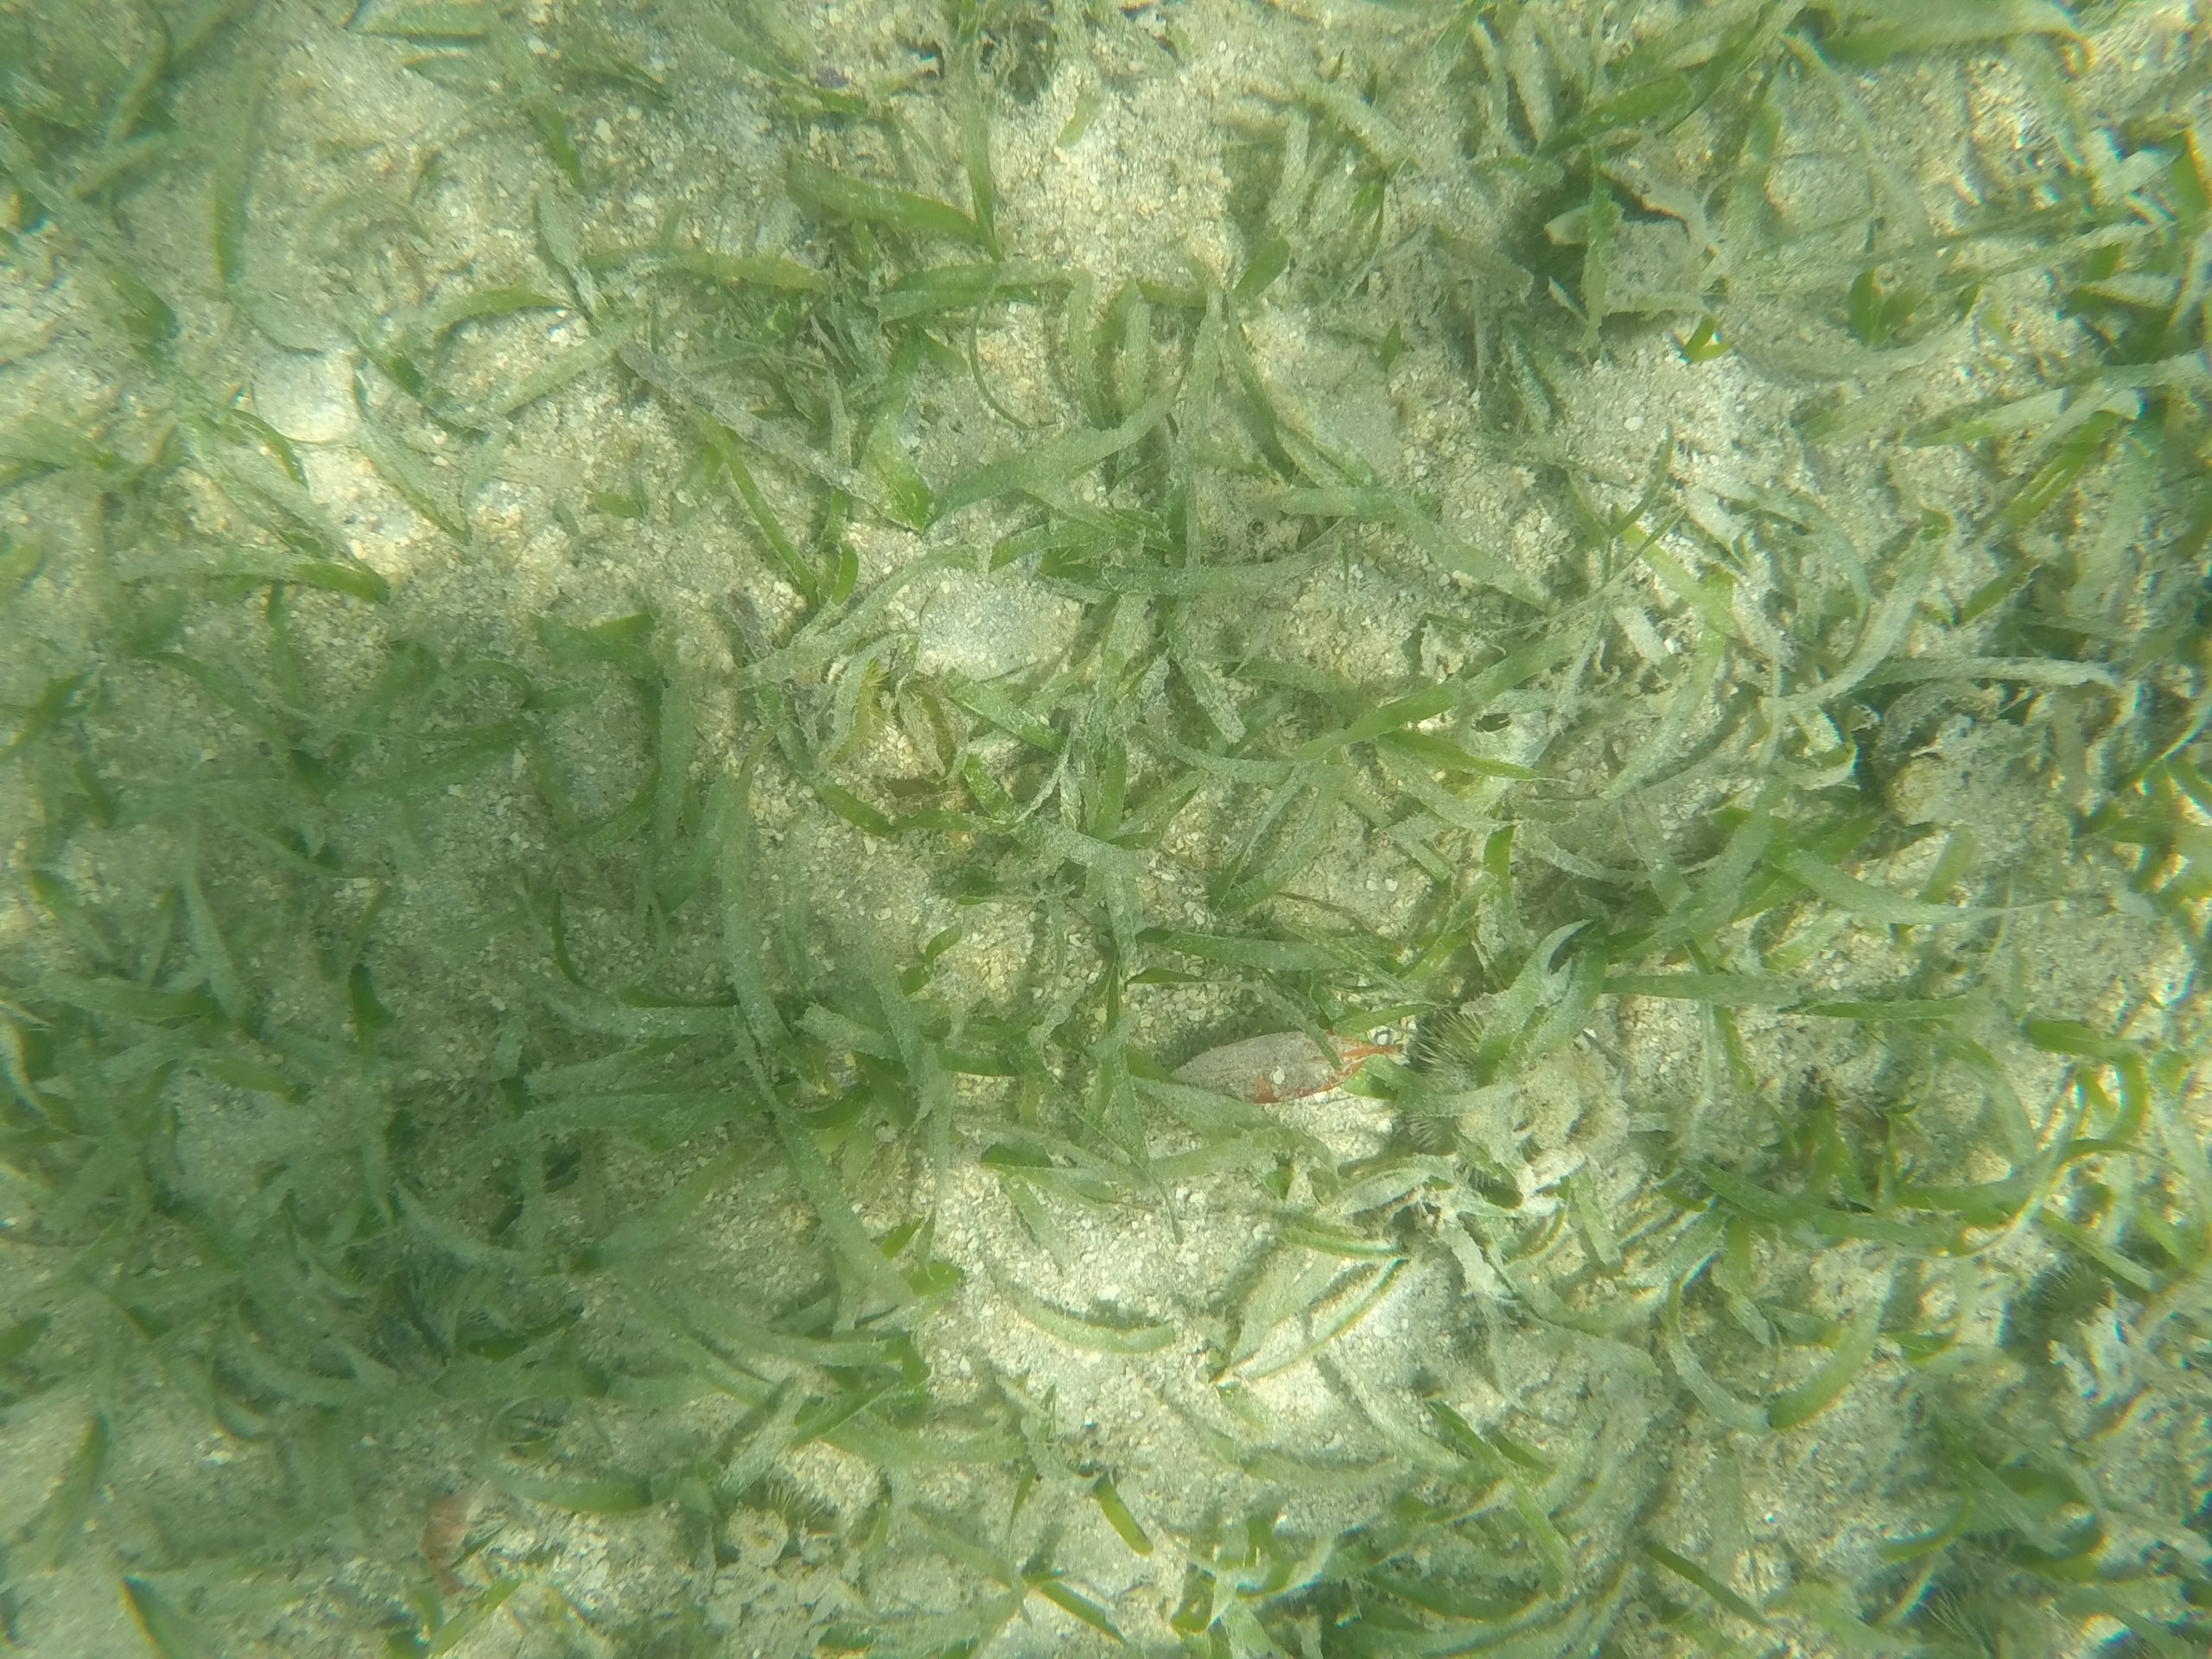
We’re taking two approaches to mapping marine ecosystems in Aruba, and how they change over time. The first is using underwater photography, taking pictures of the seafloor from kayaks, swimmers, and underwater drones to see what’s there. The second is using satellite images, which can be used to identify coral reef, seagrass, sand, and other types of seafloor cover.
The goal with this effort is to create an automated system to map reefs and other shallow-sea ecosystems. Usually, reef mapping is either done at a large scale using satellite imagery, or manually by divers. The manual methods are time consuming and expensive, so it’s hard to do them frequently. With this project we’re combining robotics and artificial intelligence to collect and analyze underwater images to create these maps more easily and hopefully more regularly.
== DIY glider ==
The design for our DIY glider is based on that of Alex Williams, which is well documented on his project page on the Hackaday website. You can also check out his 3D model on OnShape and all of his code on Github.
It’s basically a long cylinder with wings, that works by sucking water in to increase its density, which moves it down and with the wings also moves it forward. It then pushes water back out, which makes it go up and continue moving forward. It also has a weight that it can shift front to back and left to right, which tilts the glider and allows it to aim down and up and make turns.
Our design, adapted by our intrepid intern Jeremy Granadillo, has a couple of significant changes and a lot of small changes from the original design. The main difference is that it has a separated head module with a camera for collecting images of the sea floor. It’s brain is a Raspberry Pi that connects to an Arduino that operates several stepper motors to control the motion of the glider. The 3D model of that design is also on OnShape. And that code is also on Github.
Currently, our glider is not yet operational. The hardware has been assembled, and it has been partly programmed, but there is still a lot of testing to do before we can set it free in the ocean.
== Trident drone ==
In the meantime, we are starting to collect images of the seafloor using a [https://www.sofarocean.com/products/trident Trident underwater drone] from Sofar Ocean, formerly known as Open ROV. The Trident has a great camera integrated into it, but it points forward, so to photograph the sea floor it needs to have its nose pointing down. We’ve 3D printed this adapter we found on Thingiverse, and mounted it on the bottom of the drone. When we attach the GoPro to it and set it to record on timelapse mode with 0.5s intervals, it collects all the pictures we could ever want of the seafloor, as long as the water is clear enough and the drone stays upright.
== Image Classification using Zooniverse ==
Zooniverse is an online image classification crowdsourcing tool, in their words, “a platform for people-powered research”. Basically, we upload all of our pictures of the seafloor to the platform, and people everywhere can log in and look at the pictures and tell us what’s in them. At the end we can download the image data and make a map of what is in each picture.
After collecting the images using the methods above, we can add them to our Zooniverse project page, and even update it with new images as we collect them.
We need to reduce the size of the images before we upload them, as it accepts images at a maximum size of 1000kb, and the gopro takes pictures around 4-5mb. To do that in Windows we can download a program called, wait for it, Image Resizer for Windows, and it lets us select all of the images we want to resize, then right click and resize them as a batch.
To upload them, in the project you need to put them into a “Subject Set”, which can be different for different sets of pictures. So we can separate our image collections into different dates or locations. Once you click on a subject set or create a new one, you can just drag and drop your images at the bottom.
== Image Classification using AI ==
Once the images are collected, they need to be processed to create a map. Using Tensorflow, we can program a machine learning algorithm to look at the images and classify them for us. Initially, this can be done to distinguish between sand, seagrass, and coral. At a later stage further distinction can be done to assess the health of the reef. Training of the AI model is also important. Once we have some sample images, we plan to upload images to Zooniverse and open it up to the public, so people in Aruba and around the world can help train the program to map our reefs.
We had an initial workshop to learn the basics of working with Tensorflow where we were able to build a machine learning model and train it using 50 images of sand and 50 images of seagrass, and it was able to correctly identify another sample of 50 unclassified images correctly. In that workshop, we did our programming using Python, and followed this tutorial by Francium Tech to get us started. All related links for that are below.
=== Installing TensorFlow on Windows ===
We had a few issues setting up Windows to follow the tutorials mentioned above, this is what we did in order to get Tensorflow running using Sublime Text.
”Note that setting it up on Linux and Mac went fine according to the other tutorials, linked here at the bottom.”
#;install sublime
#https://conda.io/en/master/miniconda.html
#;install miniconda
#https://www.anaconda.com/blog/developer-blog/tensorflow-in-anaconda/
#;Anaconda-prompt:
#:*conda create -n tensorflow_env tensorflow
#:(tensorflow_env can be any name)
#:*type y for yes and hit enter
#:*conda activate tensorflow_env
#:*pip install pandas
#:*pip install scikit-learn
#:*pip install opencv-python
#:*pip install matplotlib
#:*pip install tqdm
#:*pip install keras
#:*conda deactivate
#https://docs.anaconda.com/anaconda/user-guide/tasks/integration/sublime/
#;in Sublime:
#:*ctrl + shift + P
#:*Start typing and select: Install Package Control in the command palette
#:*Type + select: Package Control: Install Package
#:*Type + select: Conda
#:*In the menu go to: Preferences > Package Settings > Conda > Settings – Default
#:*select all and copy (ctrl + A then ctrl + C)
#:*In the menu go to: Preferences > Package Settings > Conda > Settings – User
#:*paste (ctrl + V) and edit as follows:
#::line 5:
#::”executable”: “C:\\Users\\username\\Miniconda3\\python”,
#::line 9:
#::”environment_directory”: “C:\\Users\\username\\Miniconda3\\envs\\”,
#::line 12:
#::”configuration”: “C:\\Users\\username\\Miniconda3\\.condarc”,
#:*ctrl + S to save
#:*In the menu go to: Tools > Build System > Conda
#:*ctrl + shift + P
#:*Type + select: Conda: Activate Environment
#:*Select: tensorflow_env (or whatever you called the env you made in step 3)
#:*In the menu go to: File > Open Folder and select whatever python file you want to edit, and press ctrl + B to build / run. The console should pop up at the bottom with the outputs.
== Related links ==
;Alex Williams open source glider design
:https://hackaday.io/project/20458-open-source-underwater-glider
:https://github.com/alex-williams-2150/underwater-glider
;Jeremy Granadillo reef mapping glider revision
:https://github.com/brenchies/reef-mapping-glider
;Scoutbots robotic boat makers
:https://www.scoutbots.com/016-scoutbot-kuching/
:https://www.scoutbots.com/protei/
:https://conservationx.com/project/id/140/coralreefmappingdrone
:https://www.instructables.com/id/Scoutbot-Kuching-Robotic-Boat/
;Tensorflow workshop links
:Adding Python and Conda to PATH (go to step 4) – https://medium.com/@GalarnykMichael/install-python-on-windows-anaconda-c63c7c3d1444
:Machine Learning crash course – https://developers.google.com/machine-learning/crash-course/
:TensorFlow – https://www.tensorflow.org/
:Python – https://www.python.org/
:Anaconda – https://www.anaconda.com/download/
:MiniConda (only ~50mb) – https://docs.conda.io/en/latest/miniconda.html
:PyCharm – https://www.jetbrains.com/pycharm/
:LinkedIn Learning course homepage – https://www.linkedin.com/learning/building-and-deploying-deep-learning-applications-with-tensorflow/
:Brenchie’s Lab Github – https://github.com/brenchies
:Supervised, unsupervised, and reinforcement machine learning – https://medium.com/@machadogj/ml-basics-supervised-unsupervised-and-reinforcement-learning-b18108487c5a
:scikit-learn python machine learning tools – https://scikit-learn.org/stable/index.html
:Zooniverse crowdsourced data training – https://www.zooniverse.org/
:Image recognition tutorial / article – https://blog.francium.tech/build-your-own-image-classifier-with-tensorflow-and-keras-dc147a15e38e
:Handy file renaming software – https://www.advancedrenamer.com/download
:Saving / loading models – https://machinelearningmastery.com/save-load-keras-deep-learning-models/
== Working protocol ==
The current protocol uses image preprocessing steps taken from Kyle Hogrefe’s bathymetry Cookbook and the QGIS Semi-Automatic Classification Plugin tutorial.
=== Step by step ===
*Install OSGeo4W / QGIS
*Install Semi-Automatic Classification Plugin
#;Figure out which image you want
#:#We decided to use Landsat 8 imagery since it is free and global and recent
#:#Using the [LandsatLook viewer you can find an image that doesn’t have any clouds over your area of interest (shallow coastal waters)
#:#Check off Landsat 8 in the search box and click search, then check “Active Date Only” and find a date without clouds
#:#Write down the date of the image
#
#;Download imagery
#:#This is fairly straightforward with the SCP, start by clicking the Download Products button and select “L8 OLI/TRS” from the Products drop down menu
#:#To get your UL (upper left) and LR (lower right) latitudes and longitudes, you can right click in Google Maps and click “What’s here?” then click on the longitude and latitude that it links in the pop-up box
#:#For Aruba we used UL: X (Lon) = -70.150329; Y (Lat) = 12.669058 and LR: X (Lon) = -69.834315; Y (Lat) = 12.380330
#:#Pick dates to contain the cloud free date you identified in the first step and click the search button
#:#For Aruba we used 26-12-2016
#:#Once the results pop up, click on the one you want to make sure it looks cloud free in the preview, it should be the same image as the one you found in the LandsatLook viewer earlier
#:#Click on the button to the right of the preview that has a little map and an arrow pointing down on it, with the pop-up text “Display preview of highlighted images in map”
#:#In the Download options tab, check off bands 2 – 5 and Ancillary Data under the Landsat bands header
#:#Click RUN to download the image, select the folder where you want to save it — once you click OK there should be a status bar at the top letting you know it’s downloading
#:#Each band will be downloaded and loaded into your map as a separate layer, B2 is blue, B3 is green, B4 is red, and B5 is near infrared (NIR)
#:#Google Earth Engine has a good overview of the properties of the Landsat 8 dataset
#
#;Clip the image
#:#For Aruba, one Landsat tile is much more image than we need, so we can clip it to make processing go faster
#:#
=== Observations ===
*The deglinting process works best when applied to a relatively homogeneous area, both in terms of location and imagery. In our experience, the surface of the ocean to the north of Aruba had a significantly different wave glint pattern, which was not removed when the deglinting analysis was based on the ocean to the south, and vice versa. We also attempted to do the algorithm on a mosaic of multiple image tiles, which also showed differences between the two image areas depending on where the background glint area was selected (step 3.2 of the cookbook). We decided to focus on one satellite image at a time, and one side of the island, choosing the south side due to shallower bathymetry and higher known abundance of shallow reefs.
== Bathymetry Cookbook ==
;Steps
:#Image viewing – depends on your imagery, make sure different layers are aligned
:#Data conversion DN to radiance – Radiance = DN/Cal Coeff using raster calculation
:#Deglinting, atmosphere and water reflection correction – pick ROI with only glint, linearly regress NIR vs each band and adjust
:#Linearize spectral decay
:#Mask n/a values
:#Georectify
:#Extract spectral and depth data
:#Linear regression
:#Integrate with sonar data
;Imagery used
:IKONOS 4-band 4m geometric corrected
== Allen Coral Atlas ==
https://www.allencoralatlas.org/methods/
=== Imagery ===
;Data
:Planet’s PlanetScope satellite imagery
;Processing
:#Top of Atmosphere Radiance (TOAR)
:#Flatfield correction
:#Debayering
:#Sensor and radiometric calibration
:#Orthorectification
:#Surface reflectance
;Image mask
:For Aruba, coastal waters without land
;Mosaicking
:Done in PlanetScope imagery
=== Correction ===
;Atmospheric correction
;Waterbody retrieval
;Sun glint removal
;Depth calculation
;Bottom reflectance estimation
=== Classification ===
;Four levels of classification
:#Reef versus non-reef (0-15 m depth);
:#Reef Type (0-15 m depth);
:#Reef geomorphic zonation (0-15 m depth); and
:#Reef benthic composition (0-5 m)
== Links ==
https://drive.google.com/file/d/1gZ_8z2B-N1JnQhirYepCcNV7YXKjEW8r/view?usp=sharing
https://conservationx.com/project/id/140/coralreefmappingdrone
https://allencoralatlas.org/methods/
After downloading and stitching image>
https://www.mdpi.com/2072-4292/8/1/37/htm
== Python notes ==
Step 1: Removal of atmospheric effects — Code:
# Import the Py6S module
from Py6S import *
# Create a SixS object
s = SixS()
# Set the wavelength to 0.675um
s.wavelength = Wavelength(0.675)
# Set the aerosol profile to Maritime
s.aero_profile = AeroProfile.PredefinedType(AeroProfile.Maritime)
# Run the model
s.run()
# Print some outputs
print s.outputs.pixel_reflectance, s.outputs.pixel_radiance, s.outputs.direct_solar_irradiance
# Run the model across the VNIR wavelengths, and plot the result
wavelengths, results = SixSHelpers.Wavelengths.run_vnir(s, output_name=’pixel_radiance’)
SixSHelpers.Wavelengths.plot_wavelengths(wavelengths, results, “Pixel radiance ($W/m^2$)”)
Step 2: Deglinting & water column correction — Code
Step 3: Apply classifiers and/or create classification between contrast