Through explorations in open science sessions and in collaboration with university students and volunteers, we developed a set of tools for exploring the effects of sea level rise using Google Earth Engine. These tools are based around NDWI, an index that can be calculated from satellite imagery to indicate whether an area is water or not water (land). Using this, and by focusing on the coastal area, we can calculate changes in the area of land, which is affected by sea level rise, erosion, and infrastructure.
Island Coast
The first tool assesses changes on an entire island. After a polygon outlining the approximate coast is input, the code creates a buffer to include a bit of ocean on one side, and a bit of land on the other. These can be inspected and adjusted to make sure that the island’s coast is fully included, but inland water bodies are not.
Coastal Scan
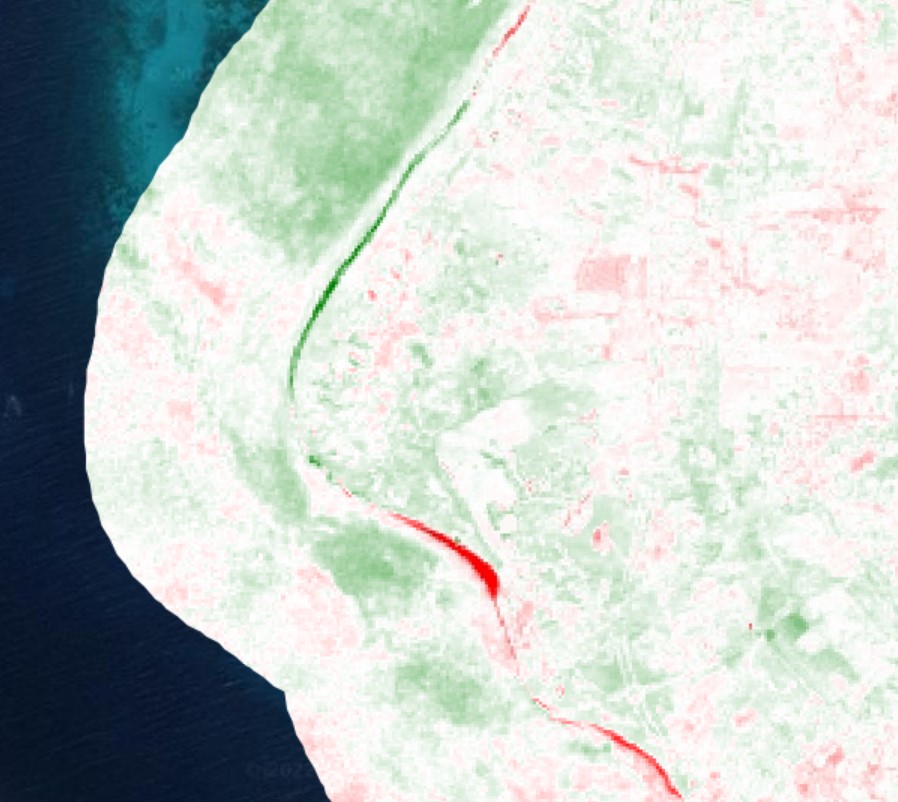
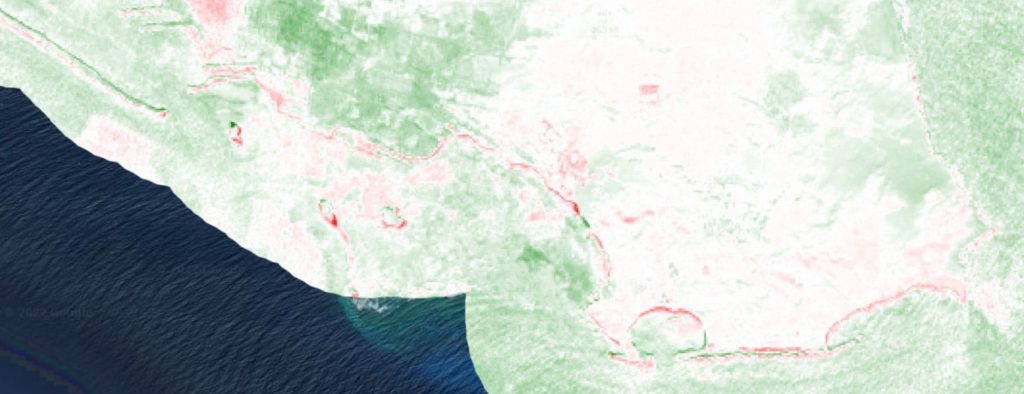
The second tool highlights potential areas of interest, by calculating the NDWI at two different time points and displaying the difference. The result is a map that shows green in areas with decreasing NDWI (indicating new land), and red in areas with increasing NDWI (indicating land loss due to erosion or sea level rise). The input is the same as with the island coast tool.
Beaches Area
The third tool is an expansion on the island coast tool, that is able to do the same calculation for a collection of polygons. The idea is that by defining smaller areas of particular concern, the calculation can be done more efficiently and accurately, and comparisons can be made within a specific beach or low-lying area, for example. This tool outputs a table of land areas for a given time period, which can be collected and plotted to map changes over time. You’ll need to create a set of polygons and save them as an asset in Google Earth Engine, but you can get started with our “arubabeaches” collection.
Inspector NDWI
The last tool is useful for inspecting a single feature from a collection, to verify that the NDWI classification aligns with expectations based on imagery. The classification is displayed in blue and green, for water and land, and it can be compared against the raw NDWI data to clarify any issues that might be occurring. This can, for example, show if some shallow ocean areas are being classified as land, or if there is some seasonal water on land that might be affecting results. The classification threshold can also be adjusted to test specific values to see how the map changes. You’ll need to specify the name of the feature you’re interested in, as well as the collection of features you’re working from.
GEE Repository: https://code.earthengine.google.com/?accept_repo=users/sevold/coast
Also on GitHub: https://github.com/brenchies/coast-mapping
Guide: Measuring Coastal Change on Islands
Notes: Updates from our coastal GIS sessions
Results for Aruba
Using the toolkit above, we defined the sandy beaches of Aruba as areas of interest for coastal change due to sea level rise and erosion and ran the code so that we could quantify changes. The data graphed and linked below were collected using annual time periods for 2016-2021, and indicate the percent change in each area from the previous year. The total of all the areas is the white dashed line with three different y-axis scales for clarity of different sites. An NDWI threshold of 0.3 was used to classify areas with water. Click on the graph to open up the spreadsheet with the full dataset.
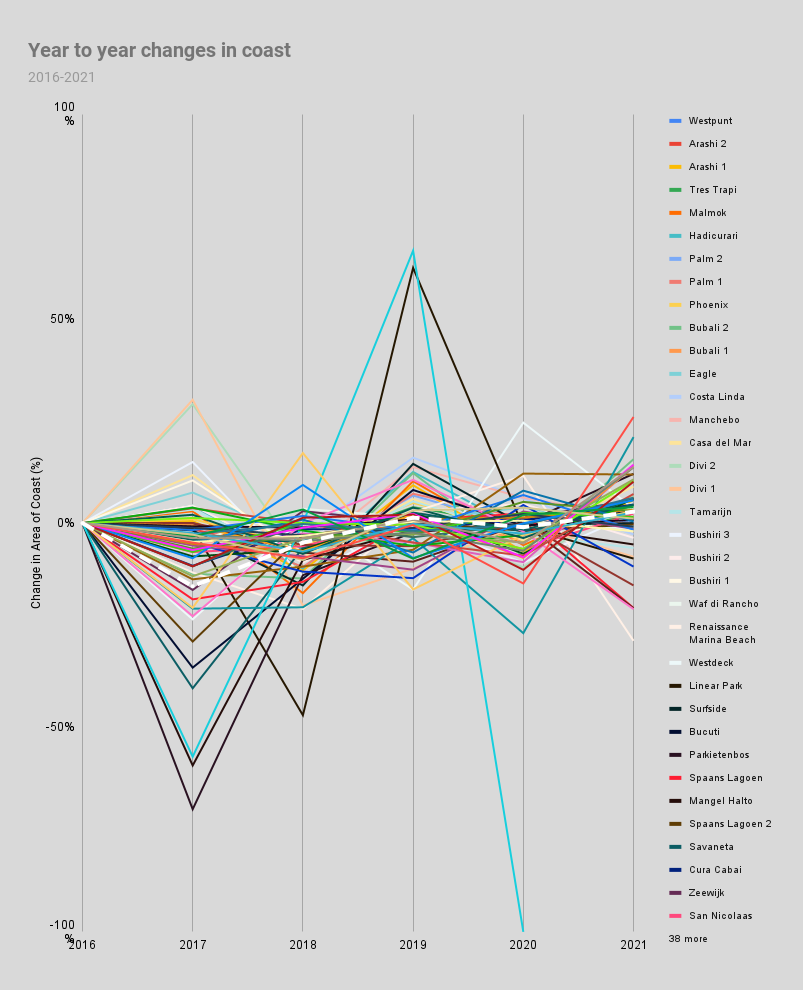
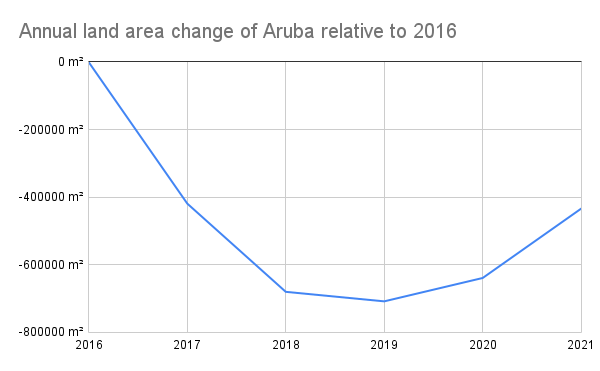
We also ran the island coast tool on a polygon of Aruba’s coastline, and plotted the changes relative to the base year of 2016. Both graphs indicate overall losses of coastal area, with some increase in recent years. This could be due to a combination of coastal development, beach nourishment, or other activities, but more focused research would be needed to identify the causes. For now we have a good overview and a lot of data and code to play around with.