The aim of this work is to use satellite data to analyze how white sand beach areas of the island of Aruba are changing over time. Aruba is strongly dependent on tourism, which relies on our beaches, so monitoring of our beaches is of core importance to the Aruban economy. The beaches are also directly related to reef health, and are affected by the adjacent coastal landscape, beach grass and other coastal plants that help maintain beach structure, as well as coral reef ecosystems that support the process of new sand production. Any techniques and results will be shared openly for use both in Aruba and on other islands and beach communities. Open source and free tools and data will be prioritized.
Code: Google Earth Engine Repo
Sessions: Oct 20, Oct 27, Nov 3, Nov 10
6-8pm at Brenchie’s Lab, Caya Betico Croes 59
Session 1 Recap
October 20
Google Earth
In our first session we went over a few different approaches we might take, and decided to start with something simple.
The approach we decided to try first uses satellite imagery and a manual technique to map beaches, literally tracing over them by drawing polygons. Google offers this functionality in Google Earth Engine, Google Earth Web, and Google Earth Pro desktop software, but only the desktop software also lets you look at historical satellite imagery from their collection. This imagery is very high resolution, much higher than other globally accessible data sets, but the raw images aren’t licensed for analysis, hence the manual approach. In our first beach mapping session, the participants found this option to be the most approachable starting point, so we each picked a beach in Aruba and proceeded to trace, starting with the most recent image, and then going back in time to try another date.
Here is the link to the maps we’ve made this way so far – Google Earth maps Folder. The files called Aruba Beaches are the most up to date and have most of the other maps combined into them.
If you want to make some maps like this, the best option is to download and install Google Earth Pro. This is the one that lets you look at past images so you can map different dates to see the difference. If you download the kmz or kml files from the link above you can import them to see how they look. You can also use either Google Earth Web or Google Earth Engine to do it for current imagery online, but you won’t be able to access any high resolution from previous dates.
Here are the links to the tool guides for tracing beaches using Google Earth (or GEE) polygons.

Session 2 Recap
October 27
NDWI
In our second session, we were a bit braver and decided to give coding a try in Google Earth Engine (GEE), starting with the Normalized Differential Water Index (NDWI). NDWI is an index that can be calculated from satellite image bands to assess the presence of water. The formula looks like this:

There are two main types, one which indicates how much moisture is present in soil or vegetation, and one which indicates the presence of liquid water on the surface. For mapping the coast, we’re interested in this second option, where we can basically use satellite images of the beach to map where the ocean starts. The NDWI calculation gives a number that ranges from -1 to 1, where higher numbers result from areas with water due to the difference in its absorption and radiation of different wavelengths of light. A threshold of about 0.2 or 0.3 is usually used, where we say any pixels in an image with an NDWI higher than that are surface water, and anything lower is not surface water. We’ll need to do a bit of figuring to decide exactly what threshold works best for Aruba’s coast.
This paper has a good intro on NDWI calculation and selection – Water Bodies’ Mapping from Sentinel-2 Imagery with Modified Normalized Difference Water Index at 10-m Spatial Resolution Produced by Sharpening the SWIR Band The authors also propose a new version of NDWI they call MNDWI, which uses the green and short-wave infrared (SWIR) bands instead of green and near infrared (NIR). In the paper they do this to avoid issues that come from built-up areas which can have similar NDWI values to water areas, and SWIR light has a bigger difference between built-up areas and water than NIR does, i.e. water absorbs SWIR light more and built-up areas reflect it more, relative to NIR. For us, we can try our code with both NDWI and MNDWI and see what the difference is in the result.
Below is the result of the first version of our GEE code, calculating the standard NDWI on Sentinel 2 imagery of the Manchebo area of Aruba. The code for that can be found here.
We notice a couple of things looking at the images above. First, there are clouds. Clouds tend to throw off satellite image analysis because they cover up what we’re interested in, the surface of the earth. Second, the MNDWI image is more pixelated. This is because the Sentinel 2 satellite collects the SWIR band in 20m resolution, so our calculation loses some detail. The third thing we notice is less obvious: the images are still a bit qualitative, so we need to do some additional math on them to calculate exactly how much of the image is water, and where the edge of the coast is.
So our next challenges are:
- Get rid of the clouds in our images
- If we want to use the MNDWI, we’ll need to see if we can get a resulting image in 10m resolution so we don’t lose any of the data we have in our green band
- Quantify our imagery somehow
For the first and third challenges, we can probably borrow some code from this NDVI calculation, which maps vegetation in Aruba and calculates what percentage of the island is above a specified threshold. It also creates a composite of all of the images in the given date range using the day when each pixel is at its greenest. So the resulting map shows the maximum vegetation. This eliminates clouds, since clouds have a low NDVI value, and they would also have a low NDWI value. The end of the code creates a map cutout of Aruba with a value of 0 where NDVI is below the threshold, and 1 where it is above. The average pixel value of this map (total pixels with 1 divided by total pixels) is the percentage of green cover.
We made an initial attempt at this the second part of this but it didn’t quite work, that code is here in case it’s helpful.
During the session, one of the participants pointed out another method for beach mapping using the CoastSat python package (Vos et al, 2019), which uses Google Earth Engine and Sentinel 2 imagery to automatically define shorelines and graph changes over time. The instructions on their Github are great for getting started with this. You need to install Anaconda and download and extract the code from their Github first and then they have a tutorial that walks you through mapping a beach in Australia.
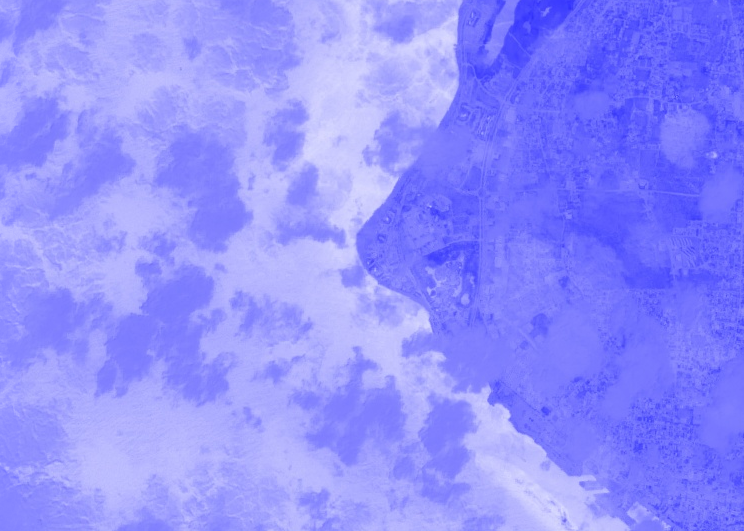
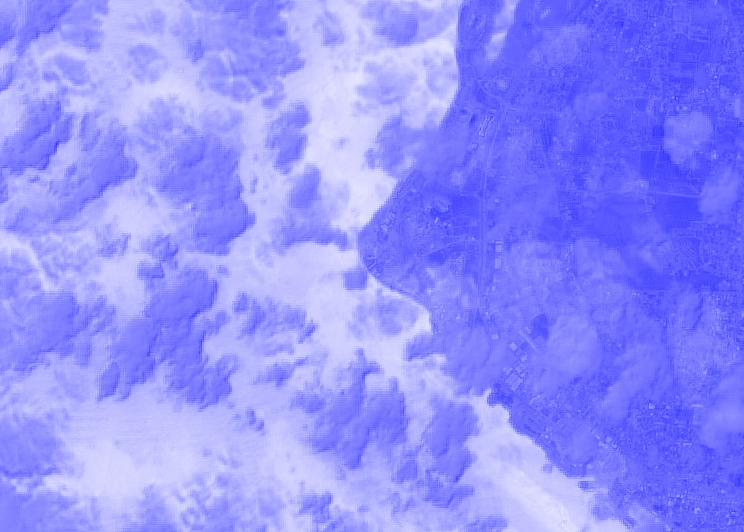
We tried it out briefly, redefining the region of interest to focus on Aruba. It didn’t quite work on the first go, it did give us these images of Aruba but we weren’t able to map the shoreline or graph it over time:
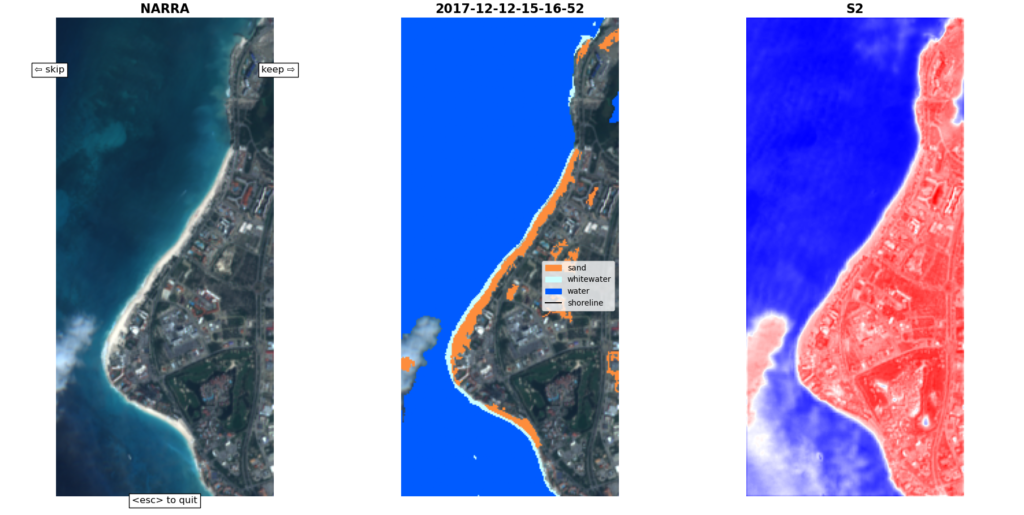
There is also an extension for CoastSat called CoastSat.islands which is designed for mapping reef islands, so we can hopefully get that working soon too.
Session 3 Recap
November 3
NDWI round 2
Goals for the night: tackling challenges faced last week
Next steps identified from our first NDWI mapping attempts:
- Get rid of clouds
- Create a map of surface water
- Calculate the area
- Compare two different time periods
This NDVI code had a lot of the pieces that we needed, so we copied and pasted some stuff from there ;)
We put together this code which didn’t work at first, but after making sure it aligned perfectly with the NDVI code above we got it to give us something, which didn’t make sense. Basically it said that a big square drawn around Aruba (including ocean) contained about 3% water. We figured out how to plot a histogram of the data, to show us a graph of the NDWI values of the pixels in the image, and it showed that most of them were close to zero. Turns out that we had the bands switched and were calculating our index backwards, i.e. normalizedDifference(B8, B3) is not the same as normalizedDifference(B3, B8), everything was inverted. After fixing it we saw our histogram improve and make sense, aligning with other NDWI histograms we had seen (page 14). That paper also says that a normal threshold for the classsic McFeeters version of the index is around 0-0.1.
Tatiana took the next step and zoomed in on a smaller area, focusing on the Manchebo area to see how it has changed over time. This area is a pretty exposed section of the most beachy part of the island, and we have seen changes in the map there while looking through images over the last few years, so we expected to see that reflected in the data. In the polygon in the code linked below, there is a roughly 3% increase in water area. Next we need to convert that to square meters.
Session 4 Recap
November 10
NDWI wrap-up
Now that we have the NDWI code working, let’s make sure we’re using it right, and try to get some information out of it. Ideas for this including making sure our threshold is set correctly, do the calculation on a couple different date ranges, and calculate the difference in area of water / beach. One approach that might help is to draw a polygon closely around a beach so we don’t have any risk of including freshwater or inland flooding. For this we might also need to define borders for the beaches we’re interested in.
We focused on the polygon drawing, with the goal of avoiding any non-beach effects of the NDWI-based-beach-area -change calculation. After some discussion, we decided to draw polygons for sections that were clearly defined, for example a boca has clear rocky coast borders, urban beaches are next to built-up areas, points separate concave beaches, and local names define distinct areas. We divided the island up and cranked through some polygon drawing, aiming to include about 50-100m on either side of the coastline, while avoiding any visible inland water bodies or pools. Next step is to combine all these polygons into an easily accessible file on Google Earth Engine and run the calculations for different time periods.
Beyond
NDWI wrap-up-wrap-up
From our last session, the next step is to combine all these polygons into an easily accessible file on Google Earth Engine and run the calculations for different time periods.
CoastSat round 1.5
We also want to see if we can get this more advanced open source program package to help us map beaches in Aruba. We got it working on the example beach in Australia, and did a quick test in Aruba, but haven’t gotten to the point of getting any useful local data out of it.
If you want to try it out yourself, here are the steps to get started:
- Download Anaconda and install it
- Download the CoastSat code (click on the green Code button and select download Zip)
- Extract the Zip file and put everything into a folder that you can find in the command line, something like
- Follow the CoastSat tutorial and read what it says!
- Now that you mapped a beach in Australia, try to make it work for Aruba
Other options
Supervised classification
Link to Google Earth Engine Tutorial – Supervised Classification
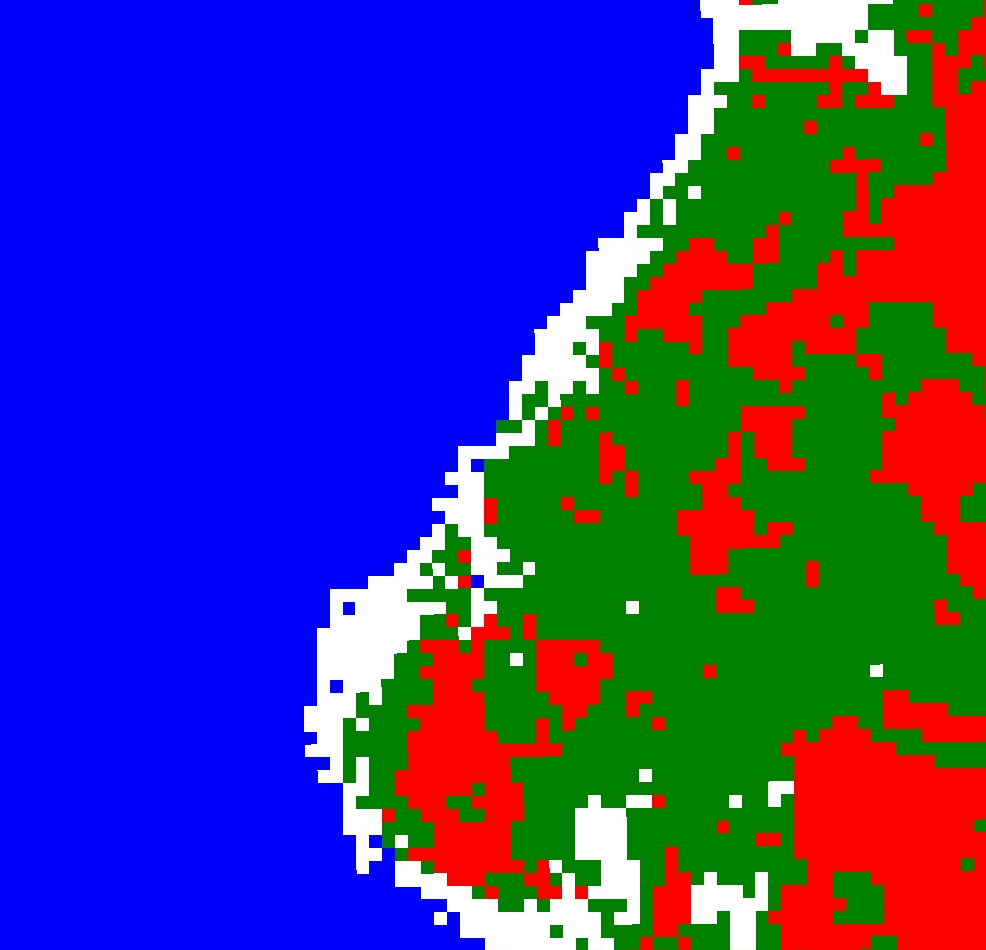
This approach is more often used for landcover mapping, when multiple different types of surface cover are interesting. For example, if you have a map and you want to identify which areas are forest, which are grass, which are concrete, which are soil, which are water, etc. The process starts with us creating training data, basically drawing shapes or clicking points over things that we identify ourselves, so we could add a square over a forest and another one over water and label them as forest and water, and then we put that training data, along with some satellite imagery, into a classifier that gets trained and then guesses what everything else is. Using this approach for beach mapping, we can train a model to identify if something is beach or not beach, or we could get more specific and add more categories if it helps. Below are two initial attempts at this using different imagery. You’ll need a Google Earth Engine account to open the links to the code:


SHOREX tool
MORE IDEAS
There are several additional ideas we have to explore in coastal monitoring and mapping:
- Using Maker Buoy with a barometer for sea level measurement
- Building a near shore digital water level sensor
- Mapping and sharing CoastSat measurements of island beaches
- Using MNDWI