
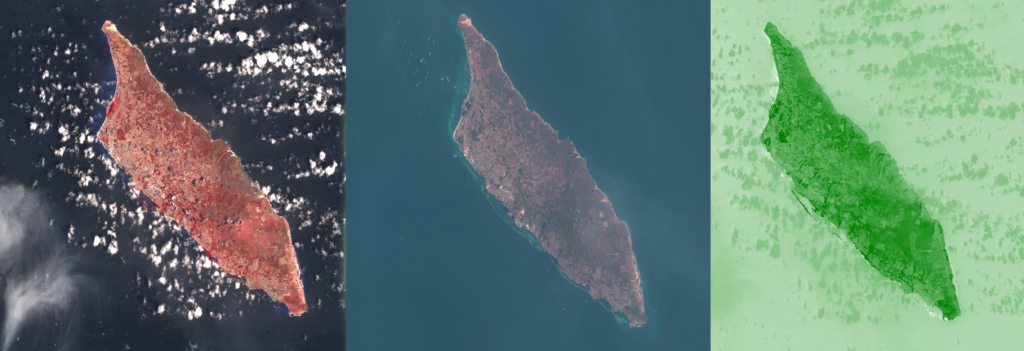
Using satellite images, we can see how green Aruba is at different times to see how rainfall, climate change, and human activity impact local plants.
https://gisgeography.com/ndvi-normalized-difference-vegetation-index/
http://profhorn.meteor.wisc.edu/wxwise/satmet/lesson3/ndvi.html
Green coverage basic protocol
- Identify dates / seasons / locations of interest
- Obtain georeferenced raster imagery
- Load into GIS software
- Overlay and trim with region of interest (if applicable)
- Calculate NDVI
- Identify threshold value for green coverage
- Perform raster statistics to count percentage of pixels above threshold
Using Google Earth Engine
Google Earth Engine is an online GIS platform that allows a lot of mapping and spatial analysis to be done by directly accessing public GIS datasets and performing analysis using javascript code.
Before you can use it, you’ll need to fill out this form to apply for access using your Google account:
https://signup.earthengine.google.com/#!/
You’ll get an email after a bit, hopefully saying you’ve been approved, which you can use to start coding your GIS analyses. To start coding, you’ll need to check out this link:
https://code.earthengine.google.com/
A good place to start is with their introductory tutorial, which you can find here:
https://developers.google.com/earth-engine/tutorial_api_01
Earth Engine example
The script for this example is accessible at the following link, under the users/sevold/ndvi repository. The script is called Arikok-NDVI-example.
https://code.earthengine.google.com/?accept_repo=users/sevold/ndvi
- Identify dates / seasons / locations of interest
- e.g. Aruba, at the end of the 2018 dry season (September 2018 was the last month with <20mm of rainfall)
- Obtain georeferenced raster imagery and…
- We’re going to use the Landsat 8 imagery, you can check out what other datasets are available here: https://developers.google.com/earth-engine/datasets/
- …load into GIS software
- The code to import the data is below.
// Import the Landsat 8 dataset

var landsat8 = ee.ImageCollection('LANDSAT/LC08/C01/T1_TOA');- Overlay and trim with region of interest (if applicable)
- If you have a specific shape you want to explore, you’ll need to import a shapefile of your region. That process is explained here. Our example of Arikok has already been uploaded and made public, so you’ll be able to load it from our database using the code below. If you don’t need such a specific area, you can also draw a shape or a rectangle using the tools on the map, or even just pick a point to center on. Once that is done, you can use the following code to filter your imagery using your location and date range.
// Import your location of interest

var ROI = ee.FeatureCollection("users/sevold/Aruba");

// Filter the Landsat 8 data using your location of interest

var spatialFiltered = landsat8.filterBounds(ROI);

// Then filter it using your dates of interest

var temporalFiltered = spatialFiltered.filterDate('2018-09-01', '2018-09-30');- Calculate NDVI
- This process takes us from a collection of images to a single ndvi map of Aruba
// This is a function to calculate NDVI from a Landsat 8 raster and add it as another layer

var addNDVI = function(image) {
  var ndvi = image.normalizedDifference(['B5', 'B4']).rename('NDVI');
  return image.addBands(ndvi);
};

// Here we apply the function above to our filtered image collection

var withNDVI = temporalFiltered.map(addNDVI);

// Collect peak "greenness" from our images into one map

var greenest = withNDVI.qualityMosaic('NDVI');

// And cut it out to the shape of our region

var greenROI = greenest.clip(ROI);

// Display the result by it's NDVI value

var visParams = {min: -1, max: 1, bands: ['NDVI'], palette: ['blue', 'white', 'green']};

Map.centerObject(ROI, 11);

Map.addLayer(greenROI, visParams, 'Max NDVI mosiac');- Identify threshold value for green coverage
- Technically speaking, any NDVI above 0 has some level of vegetation, but the value that represents healthy vegetation depends on the ecosystem you’re looking at.
// Set a threshold for vegetation on the NDVI index

var threshold = 0.2;- Perform raster statistics to count percentage of pixels above threshold
- This step is a bit awkward but it works. It will output a value from 0 to 1, indicating what fraction of the area has vegetation. (Multiply by 100 to get it as a percentage)
// This makes a map with 0 values for non-vegetation, and 1 values for vegetation

var vegetation = greenROI.select('NDVI').gt(threshold);

// This takes the average (mean) value of our vegetation map, aka the Green Coverage

var green = vegetation.reduceRegion({
  reducer: ee.Reducer.mean(),
  geometry: ROI,
  scale: 30
});

// Print out the value of our green coverage in the console so you can write it down!

print(green);
=== Data sets ===
{| class=”wikitable”
|-
! Dataset
! Dates
! Aruba?
! NIR band
! Resolution
! Notes
! Link
|-
| Landsat 8
| 2013 – present
| yes
| B5
| 30m
|
| https://developers.google.com/earth-engine/datasets/catalog/landsat-8/
|-
| Landsat 7
| 1999 – present
| yes
| B4
| 30m
| missing data 2003 –
| https://developers.google.com/earth-engine/datasets/catalog/landsat-7/
|-
| Landsat 5
| 1984 – 2012
| no!
| B4
| 30m
| someone deleted Aruba
| https://developers.google.com/earth-engine/datasets/catalog/landsat-5/
|-
| Landsat 4
| 1982 – 1993
| maybe
| B4
| 30m
|
| https://developers.google.com/earth-engine/datasets/catalog/landsat-4/
|-
| Sentinel-2 MSI
| 2015 – present
| maybe
| B8
| 10m
|
| https://developers.google.com/earth-engine/datasets/catalog/sentinel-2/
|}
== Python with Planet data==
;Tutorial 1
:https://medium.com/analytics-vidhya/satellite-imagery-analysis-with-python-3f8ccf8a7c32
;Tutorial 2
:https://danielmoraite.github.io/docs/satellite1.html
:https://danielmoraite.github.io/docs/satellite2.html
:https://medium.com/dataseries/satellite-imagery-analysis-with-python-a06eea5465ea
;Image stitching
:https://www.pyimagesearch.com/2018/12/17/image-stitching-with-opencv-and-python/
;Notes
:[https://docs.google.com/document/d/1Zo4zagJ03FrRsvR9MBhcG8XfH2BQb7dWPSKY5VyHuIo/edit?usp=sharing Python + Planet Vegetation Mapping]
== QGIS landcover classification ==
;Tool
:Semi-Automatic Classification Plugin
;Tutorial
:https://fromgistors.blogspot.com/search/label/Tutorial
;User Manual
:https://buildmedia.readthedocs.org/media/pdf/semiautomaticclassificationmanual/latest/semiautomaticclassificationmanual.pdf
;Image stitching
:https://medium.com/@robsimmon/making-sense-of-satellite-data-an-open-source-workflow-stitching-data-with-qgis-d004c2184ebb
== Notes ==
Current workflow:
#Planet Explorer search — find images of interest and place order
#Download order once ready
#Copy analytic .tif files into /data folder and rename 1, 2, 3, 4, etc..
#Run gdal python code to merge
#Run NDVI to analyze merged image
#Repeat for another date
#Compare using QGIS
=== Aruba’s climate data ===
Rainy season:
Dry season:
[http://meteo.aw/climate.php Meteo climate data (PDF format)]
[https://docs.google.com/spreadsheets/d/1xEBSj9qrOoEKXSBKqQt47KX-iz8BwuxRCUfk5VT0RBw/edit?usp=sharing Rainfall data from Meteo (Google sheet)]
—–
Installing Python, packages, and jupyter:
install sublime
https://conda.io/en/master/miniconda.html
install miniconda
install python libraries
*pip install planet
*pip install rasterio
*pip install numpy
*pip install matplotlib
*pip install requests
*pip install jupyter
*pip install pandas
—–
Image search and NDVI with Planet API:
https://danielmoraite.github.io/docs/satellite1.html
https://danielmoraite.github.io/docs/satellite2.html
Tutorial code: https://github.com/DanielMoraite/DanielMoraite.github.io/blob/master/assets/Downloading%20from%20Planet-Copy1.ipynb
ROI GeoJSON tool:
http://geojson.io/#map=10/12.4372/-430.1367
Aruba boundaries:
[-430.07904052734375,12.403047708545364],[-429.8579406738281,12.403047708545364],[-429.8579406738281,12.6363182557884],[-430.07904052734375,12.6363182557884],[-430.07904052734375,12.403047708545364]
Data from Planet:
https://developers.planet.com/docs/api/psscene4band/
https://developers.planet.com/docs/quickstart/downloading-imagery/
Open Street Map data downloading using QGIS or Python:
https://www.e-education.psu.edu/geog585/node/739
Less cool option but with only one button:
https://mdl.library.utoronto.ca/technology/tutorials/exporting-map-data-openstreetmap
Medium cool option with graphical interface:
Hackathon:
—–
Image stitching:
Layer > Add Layer > Add Raster Layer
Open various raster files (aruba_ndvi#.tif)
Raster > Miscellaneous > Merge
*issue: need to ignore “no data” cells in merge
https://gis.stackexchange.com/questions/209661/merge-raster-layers-with-nodata-cells
https://gis.stackexchange.com/questions/85499/merge-two-rasters-with-no-data-value/85545#85545
https://github.com/dwtkns/gdal-cheat-sheet
https://www.gdal.org/gdal_merge.html
https://www.gdal.org/gdalwarp.html
https://developers.planet.com/planetschool/creating-a-mosaic-in-python/
—–
Vegetation indices:
Landcover classification
https://www.ncbi.nlm.nih.gov/pmc/articles/PMC3105321/
https://landsat.usgs.gov/what-are-best-spectral-bands-use-my-study