A brief overview of how you can adapt our coastline mapping script for different locations and beaches
Date: 23 January 2024
INTRO
During the Surfside Science project, funded by the EU through the RESEMBID programme, we developed GIS scripts using the Google Earth Engine platform to map Surfside beach in Aruba. This code was then adapted from javascript to python to be able to run over past time periods and automatically run for new time periods as more imagery becomes available.
These maps include:
- Coastal mangrove vegetation
- Coastline
- Seafloor habitat type
- Reef islands
This guide describes the process of adapting these scripts for different locations, which can then be run over historical imagery and added into our list of automated scripts to be included in the open environmental data portal accessible at https://data.brenchies.com/
REPOSITORIES
For reference, the Google Earth Engine repository is here:
https://code.earthengine.google.com/?accept_repo=users/sevold/sss
And the scripts in both javascript and python are on our Github here:
https://github.com/brenchies/surfsideGEE
GOOGLE EARTH ENGINE
Google Earth Engine is an online GIS platform that allows a lot of mapping and spatial analysis to be done by directly accessing public GIS datasets and performing analysis using javascript code. Before you can use it, you’ll need to fill out this form to apply for access using your Google account:
https://signup.earthengine.google.com/#!/
You’ll get an email after a bit, hopefully saying you’ve been approved, which you can use to start coding your GIS analyses. To start coding, go to:
https://code.earthengine.google.com/
A good place to start is with their introductory tutorial, which you can find here:
https://developers.google.com/earth-engine/tutorial_api_01
MAPPING A NEW BEACH
Below is the step by step process for applying our coastline script to a new beach.
Google Earth Engine
- Choose a beach that you know and love. This isn’t absolutely necessary, but if this is your first time mapping a new beach it will help if you’re familiar with the area.
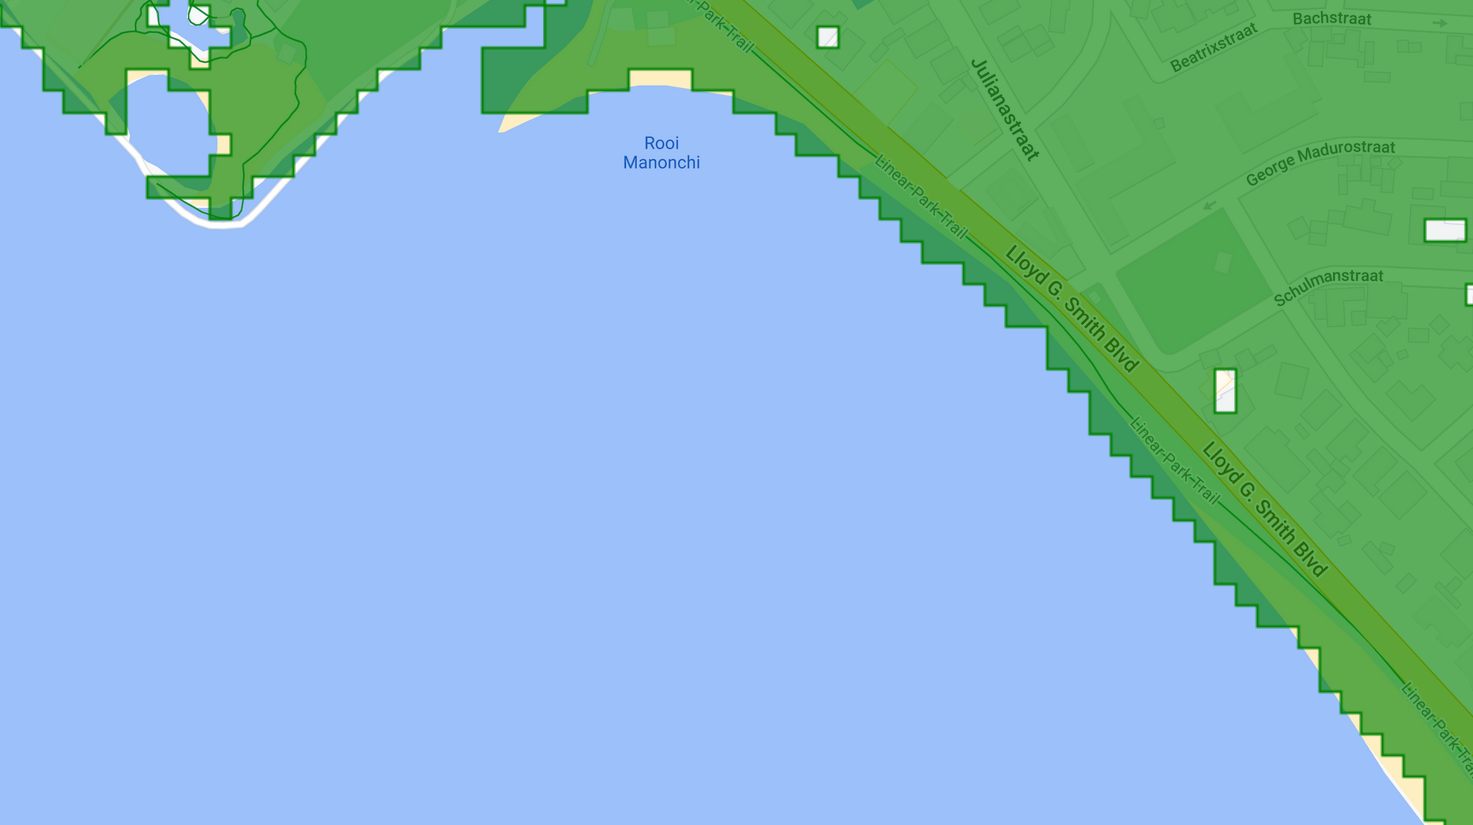
- Pick a topic to map from the available scripts. For this guide we’ll look at the coastline, which determines the boundary between water and land.
- Open the Coastline script in Google Earth Engine (GEE). In case the repository link doesn’t work, you can open this link to access a snapshot of the code. This link won’t update, so it might be an older version depending on when you’re reading this. If possible, always use the code linked in the repository.
- Look through the code, read the comments and lines of code, paying attention to the variables near the top. If there’s anything where you have no idea what’s happening, let us know and we can help explain it.
- Click on the map in the bottom part of the screen, and find the beach that you’re interested in mapping. Zoom in until it is in clear view. You can switch the view mode to Satellite if it helps.
- Click on the square box tool in the top left of the map and draw a rectangle around your beach. This will create a rectangle named ‘geometry’ which appears above your code in a section called ‘Imports’.
- For a quick result, let’s write a new line of code on line 3, under the one that says var roi = ee.Geometry.BBox, that says roi = geometry;
- Now click run to see the coastline of your beach.
- In the map area there is a button that says ‘Geometry imports’, if you hover over it you will see check boxes that you can disable to hide your region of interest. Click them to see your coastline more clearly.
- Now you can explore your beach at different time points, try changing the dates on lines 6-7. These dates control the window of time for the analysis, for example if they span one month, the script will consider all images collected within that month and combine them into a quality composite. The aim is to include enough images for us to have a complete composite, but also to focus on time periods over which we expect to see changes. For example, if we look at a single clear day at high tide, and compare with another clear day at low tide, we will see the change due to the tide. If we’re interested in coastal erosion and deposition, representing longer term changes, we need to look at a period of at least a month, and maybe up to a year if we want to include seasonal changes.
- You’ll see a number appear in the console to the right that says “hectares of coast in roi”. This is only interesting if we compare it to another time period, to see the difference. Then we can calculate how much more or less area of land there is at our beach.
- You might also notice an orange tab in the upper right that says ‘tasks’. If you want, you can click on it and run one of the tasks if you want to export your data to Google Drive, for downloading and analysis in QGIS or other GIS software. It takes a little while to process, so we can skip this for now.
- Next we will move our geometry import into the code for convenience. Click on the import at the top of your code screen, the little arrow next to ‘var geometry’. Then click the arrow next to ‘coordinates’ and the one next to ‘0: List’ to see the points in the polygon you drew. There should be 10 numbers here, but there are only 4 different ones. We need to copy those 4 into the ee.Geometry.BBox code on line 2. It doesn’t really matter which order you put them in, as long as you have all 4 different values corresponding to the longitude and latitude of your box boundaries.
- If you want you can remove some of the very precise digits to make the code look a bit simpler, but make sure to check that it still covers your beach well. In our analysis of Surfside, we found that three decimal places was enough precision to specifically include our area of interest.
- Now delete line 3 that you wrote earlier, the one that says ‘roi=geometry’ and run the code again to make sure it still works the same.
Python
- Download the coastline.py code from the github repository
- Open it in a text editor or a code editor and read through it to see how it compares to the javascript version we worked with in GEE
- Edit the line that sets the region of interest, and replace the bounds with the ones you have on line 2 of your GEE script
- Save it as ‘coastline-mybeach.py’
- Email it along with a link to your GEE script to science@brenchies.com and we will try to add it to our database. Thanks for contributing!
- Next you can try adapting the script for other beaches, or adapt our seafloor mapping script for your beach. Seafloor mapping is a bit more involved and you’ll need to give it some training data. If you want to try it out let us know and we can put together another tutorial!